Articles & News
Market Report
Firm foundation in place for the sales season
Published: 03.26.2024
After several years of frenetic activity, limited inventory, and increasing property values, Lake Martin real estate sales data indicates a stable market for 2024. Our year-over-year data is filled with mostly positive results for waterfront property. This information gives us confidence for current and prospective owners.
As usual, we have gathered the data for the most recent 12-month period, in this case ending February 29, 2024, and compared it to the same period last year. This helps us see bigger trends while month-over-month results can give us some “real time” confirmation. To confirm our belief noted above, we will use some of both types of data.
Key results from the 12-month period are as follows: (Data derived from the local MLS)
Waterfront Gross Sales Volume
Single-family, condos, and townhomes – a 10.1% increase to $301,056,546
Single-family only – 11.7% increase to $278,923,846.
Condos and townhomes only – a 7.1% decrease to $22,132,700
Waterfront Unit Sales Volume
Single-family, condos, and townhomes – a 3-unit decrease to 253 properties
Single-family only – an 8-unit increase to 210 properties
Condos and townhomes only – an 11-unit decrease to 43 properties
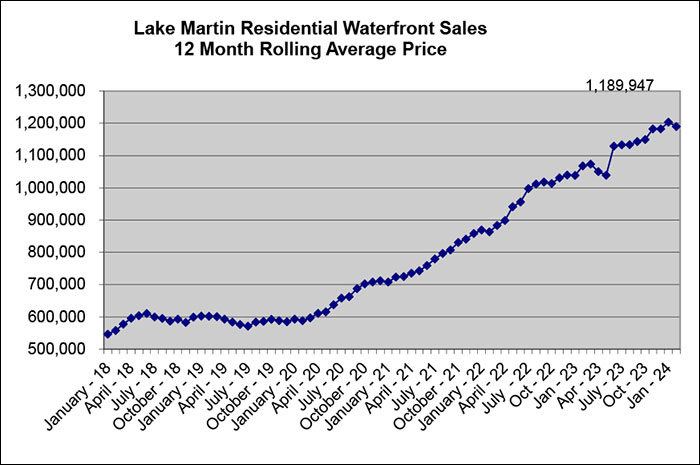
Waterfront Average Price
Single-family, condos, and townhomes – an 11.4% increase to $1,189,947
Single-family only – a 7.5% increase to $1,328,209
Condos and townhomes only – a 16.6% increase to $514,714
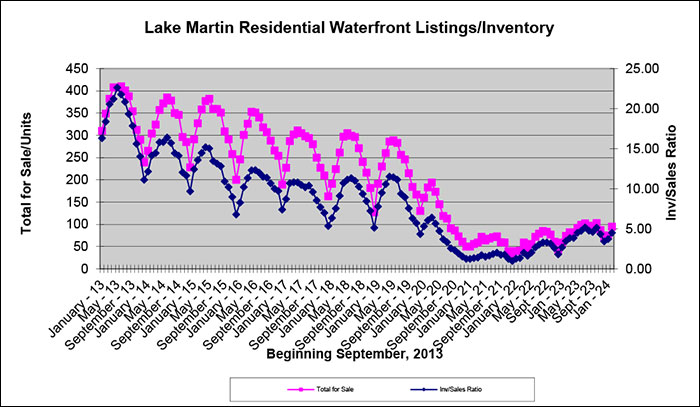
Waterfront Available Inventory
Single-family, condos, and townhomes – an increase of 21 units – from 74 to 95 properties
Single-family only – an increase of 6 units – from 62 to 68 properties
Condos and townhomes only – an increase of 15 units – from 12 to 27 properties
Analysis of the data
The charts below show the sales data for waterfront residential property, dating back to January 2013 when the real estate market began to recover from the “great recession.” The first chart shows the 12-month rolling average for the sales volume for that period. There was a fairly steady increase every year with slight reductions due to the political cycle in 2016 and increasing interest rates in 2019.
This steady increase changed dramatically due to COVID in 2020. Lake Martin was “rediscovered” that summer, and the abundant for sale inventory was cleared out almost overnight. That created what we call today, “the COVID peak.”
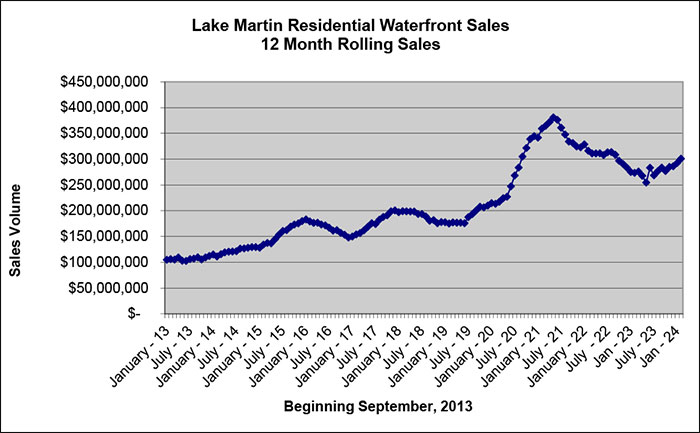
Since then, due to lower inventory and higher interest rates, sales volumes began to decrease. However, we began to notice back in the summer that a new normal was beginning to take hold in the market, as sales volumes began to return to an upward trend. Two of the reasons for this are because interest rates stabilized and demand was still robust.
Another reason sales volume grew is because inventory began to increase as well. The chart below shows the inventory level in pink, which is 95 units currently, and the inventory-to-sales rate in blue, which shows a 4.51-month supply currently. To give context to all of the charts, prior to the COVID peak, 2019 was a record sales year for the lake. At the end of 2019, inventory stood at roughly 200 properties with an inventory-to-sales rate of just over a 6-month supply. Current inventory is lower, and sales volume is higher, indicating a healthy market.
The outcome, due to increased volume and lower inventory, is that sales prices increase (as can be seen in the numbers above and the chart below). While sales volume has decreased and inventory has increased since COVID, the average sales price has continued its steady climb. There does not appear to be anything in the data that indicates a reversal of that trend.
Recent data confirms the trend
February’s data for sales confirms our belief in a firm market foundation. For that month, 17 waterfront residential properties closed versus just 7 last February. The average price did decrease from $1,444,929 to $1,097,087. That appears to be an anomaly because the number of properties that were reported as going under contract in February increased from 20 in 2023 to 23 in 2024. The average list price for those properties last year was $757,100 versus $1,249,351 this year.
As noted above, month-over-month data can be volatile, but it also can help confirm continuations in the trends. In this case, there are more sales and higher volumes, and the higher priced properties are going under contract.
What to look for
We are watching with great interest how long newly listed properties stay on the market until sold or how many properties fail to sell. So far, properties that sell stay on the market for 104 days, which is still below the long-term average of roughly 180 days. We have not noticed more than a handful of failed attempts to sell a properly priced property in good condition.
We also expect that Lake Martin will be a very attractive marketplace when the weather warms up this spring. Ultimately the lake gives us the best foundation for our real estate market. Since we have one of the best lakes in the world, we should have one of the best markets too.
If you need any additional information on the market, property values, or availability, reach out to one of our Realtors®.